Time series
Time series and temporal data
Time series visualisations communicate how something changes over time. In almost all of these charts the x-axis (the horizontal axis) represents time.
Typically, these time series visualisations are used to communicate one of three things:
- Precise events on a timeline: a letter is sent, or received.
- Periods of time: a worker is assigned to a particular project for X days.
- Variation in a variable over time: stock prices or global temperature measurements over time.
When working with temporal data it’s extremely important to be careful with the format of your data as the “time” component of your data may contain any combination of the following; HH:MM:SS, YYYY-MM-DD and time zone.
| Name | Example | What is this useful for? | User data required |
|---|---|---|---|
| Gantt chart | 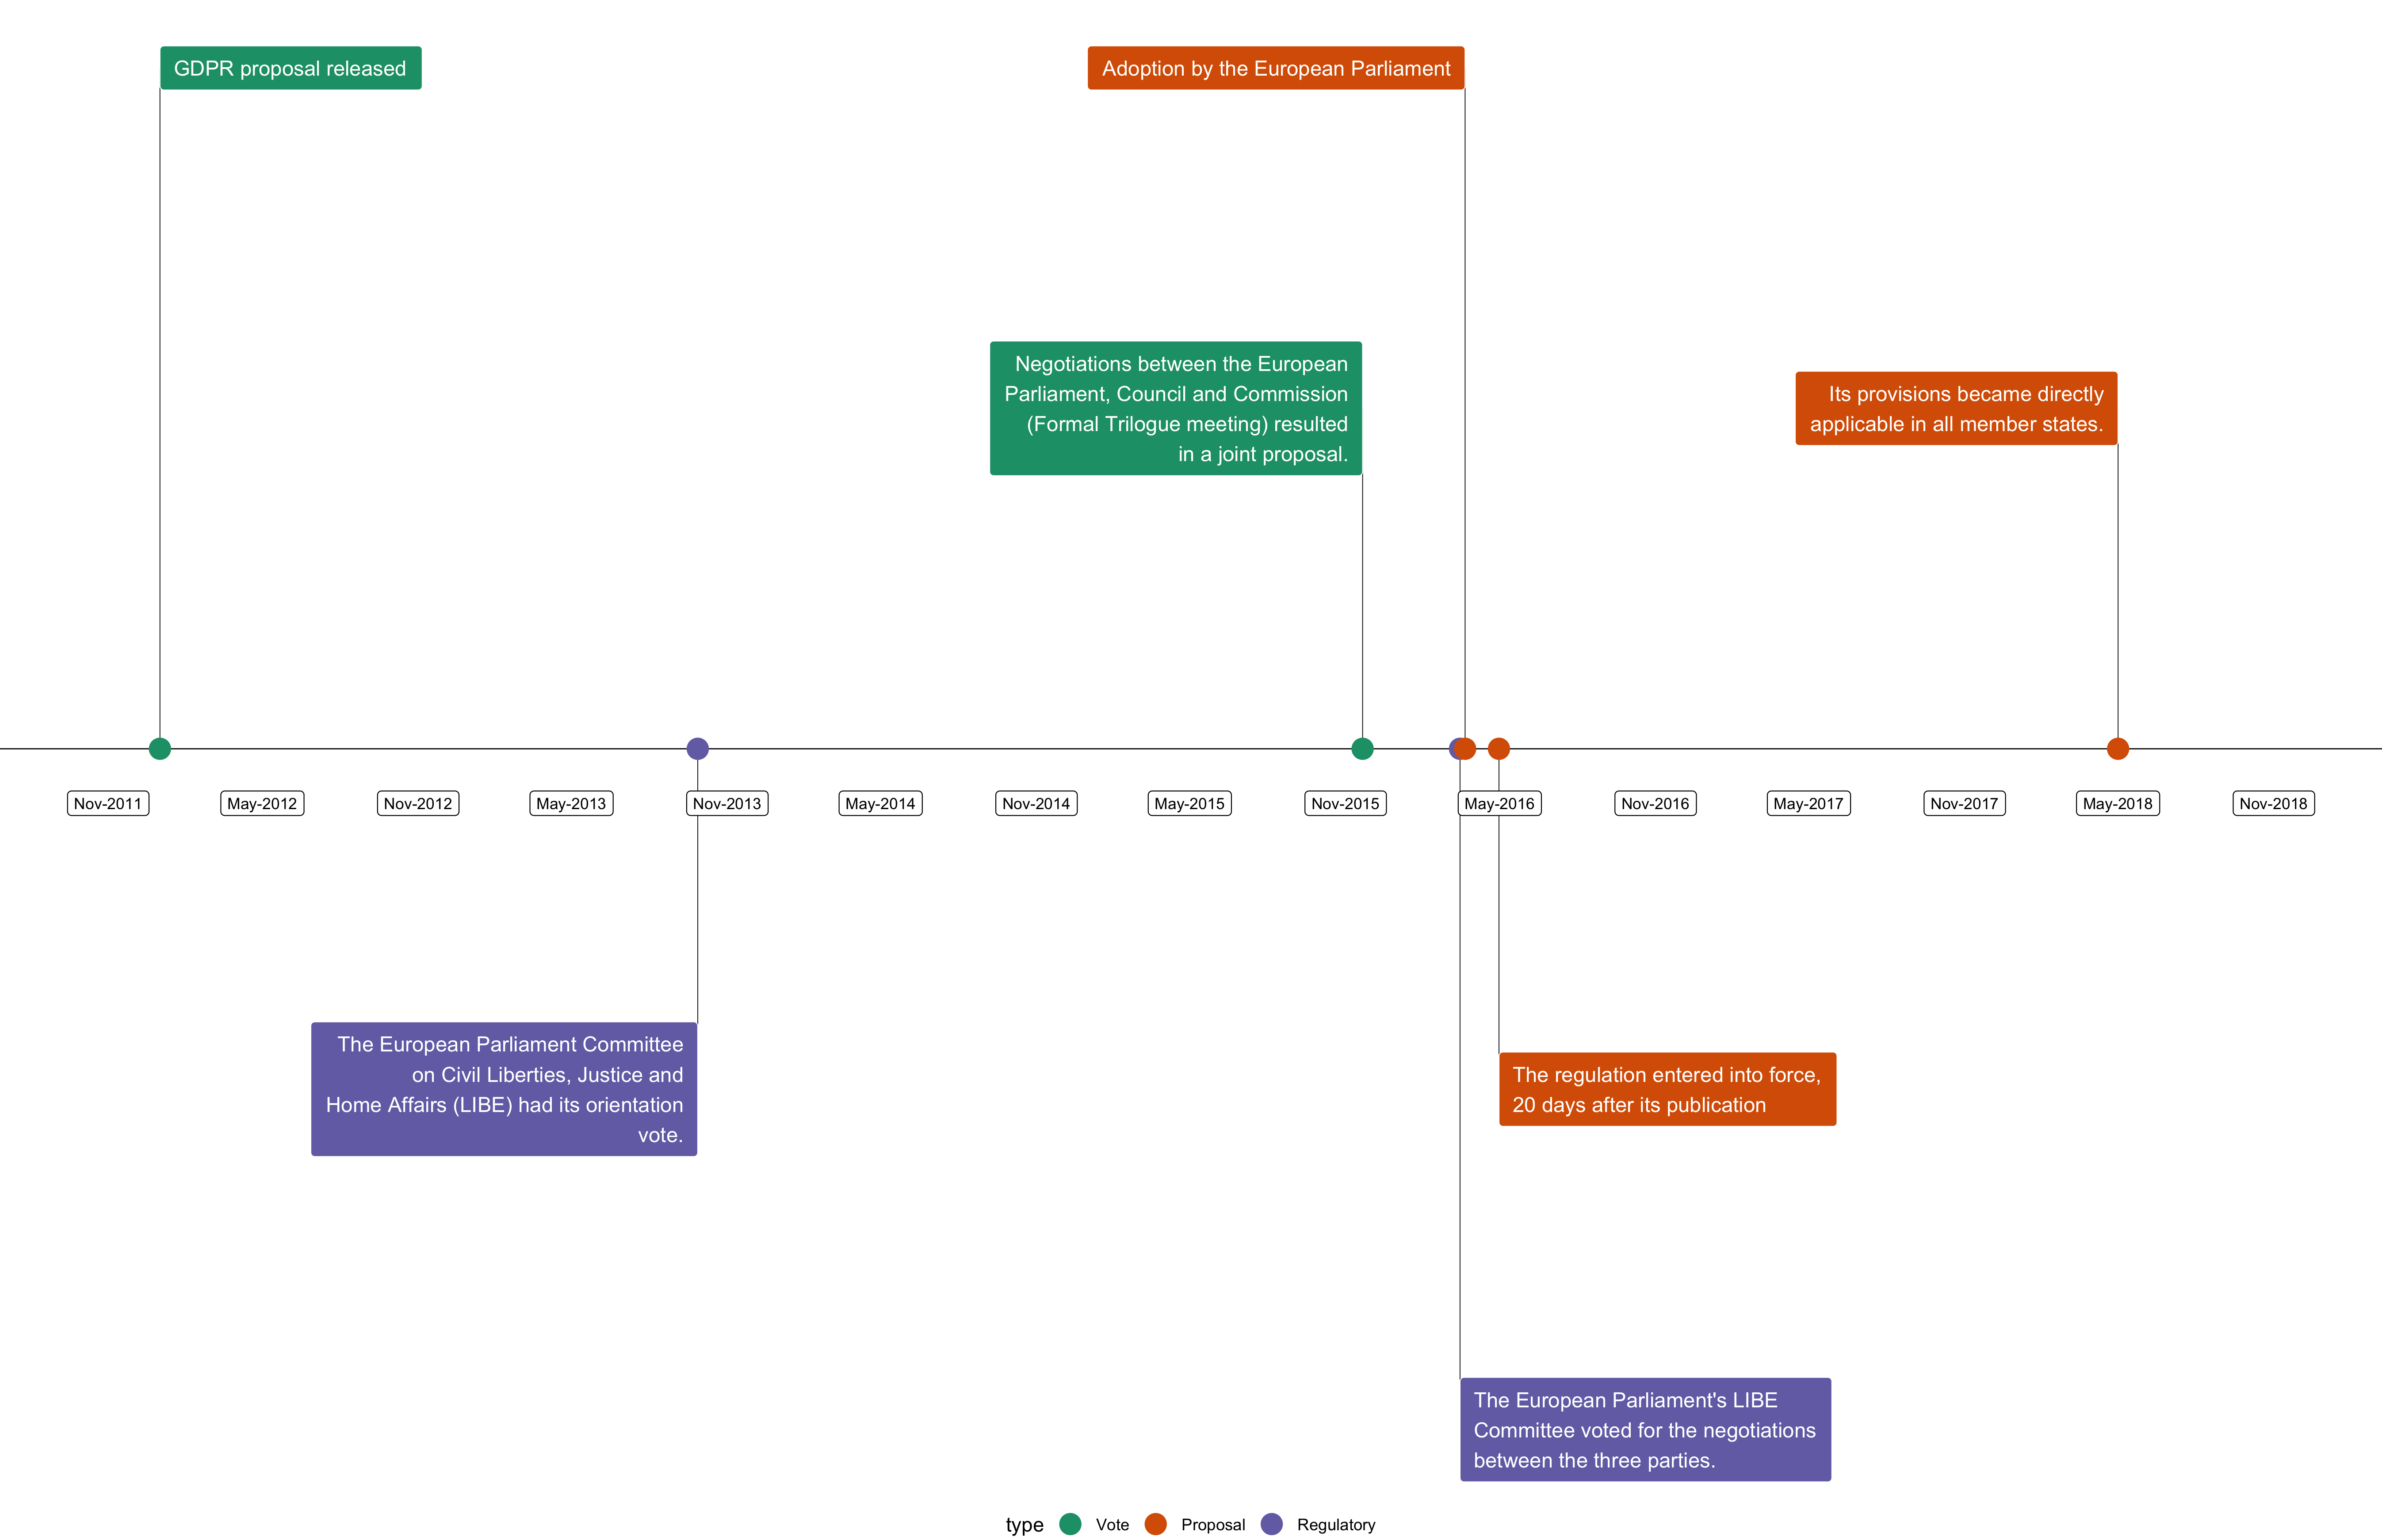 |
Gantt charts are useful for comparing periods of time that overlap or are dependent on one another.
Gantt charts are therefore primarily used for business intelligence and project management. Many folks use Gantt charts without knowing that's what they’re called. Gantt charts may also have discrete events displayed on them. |
|
| Timeline chart | 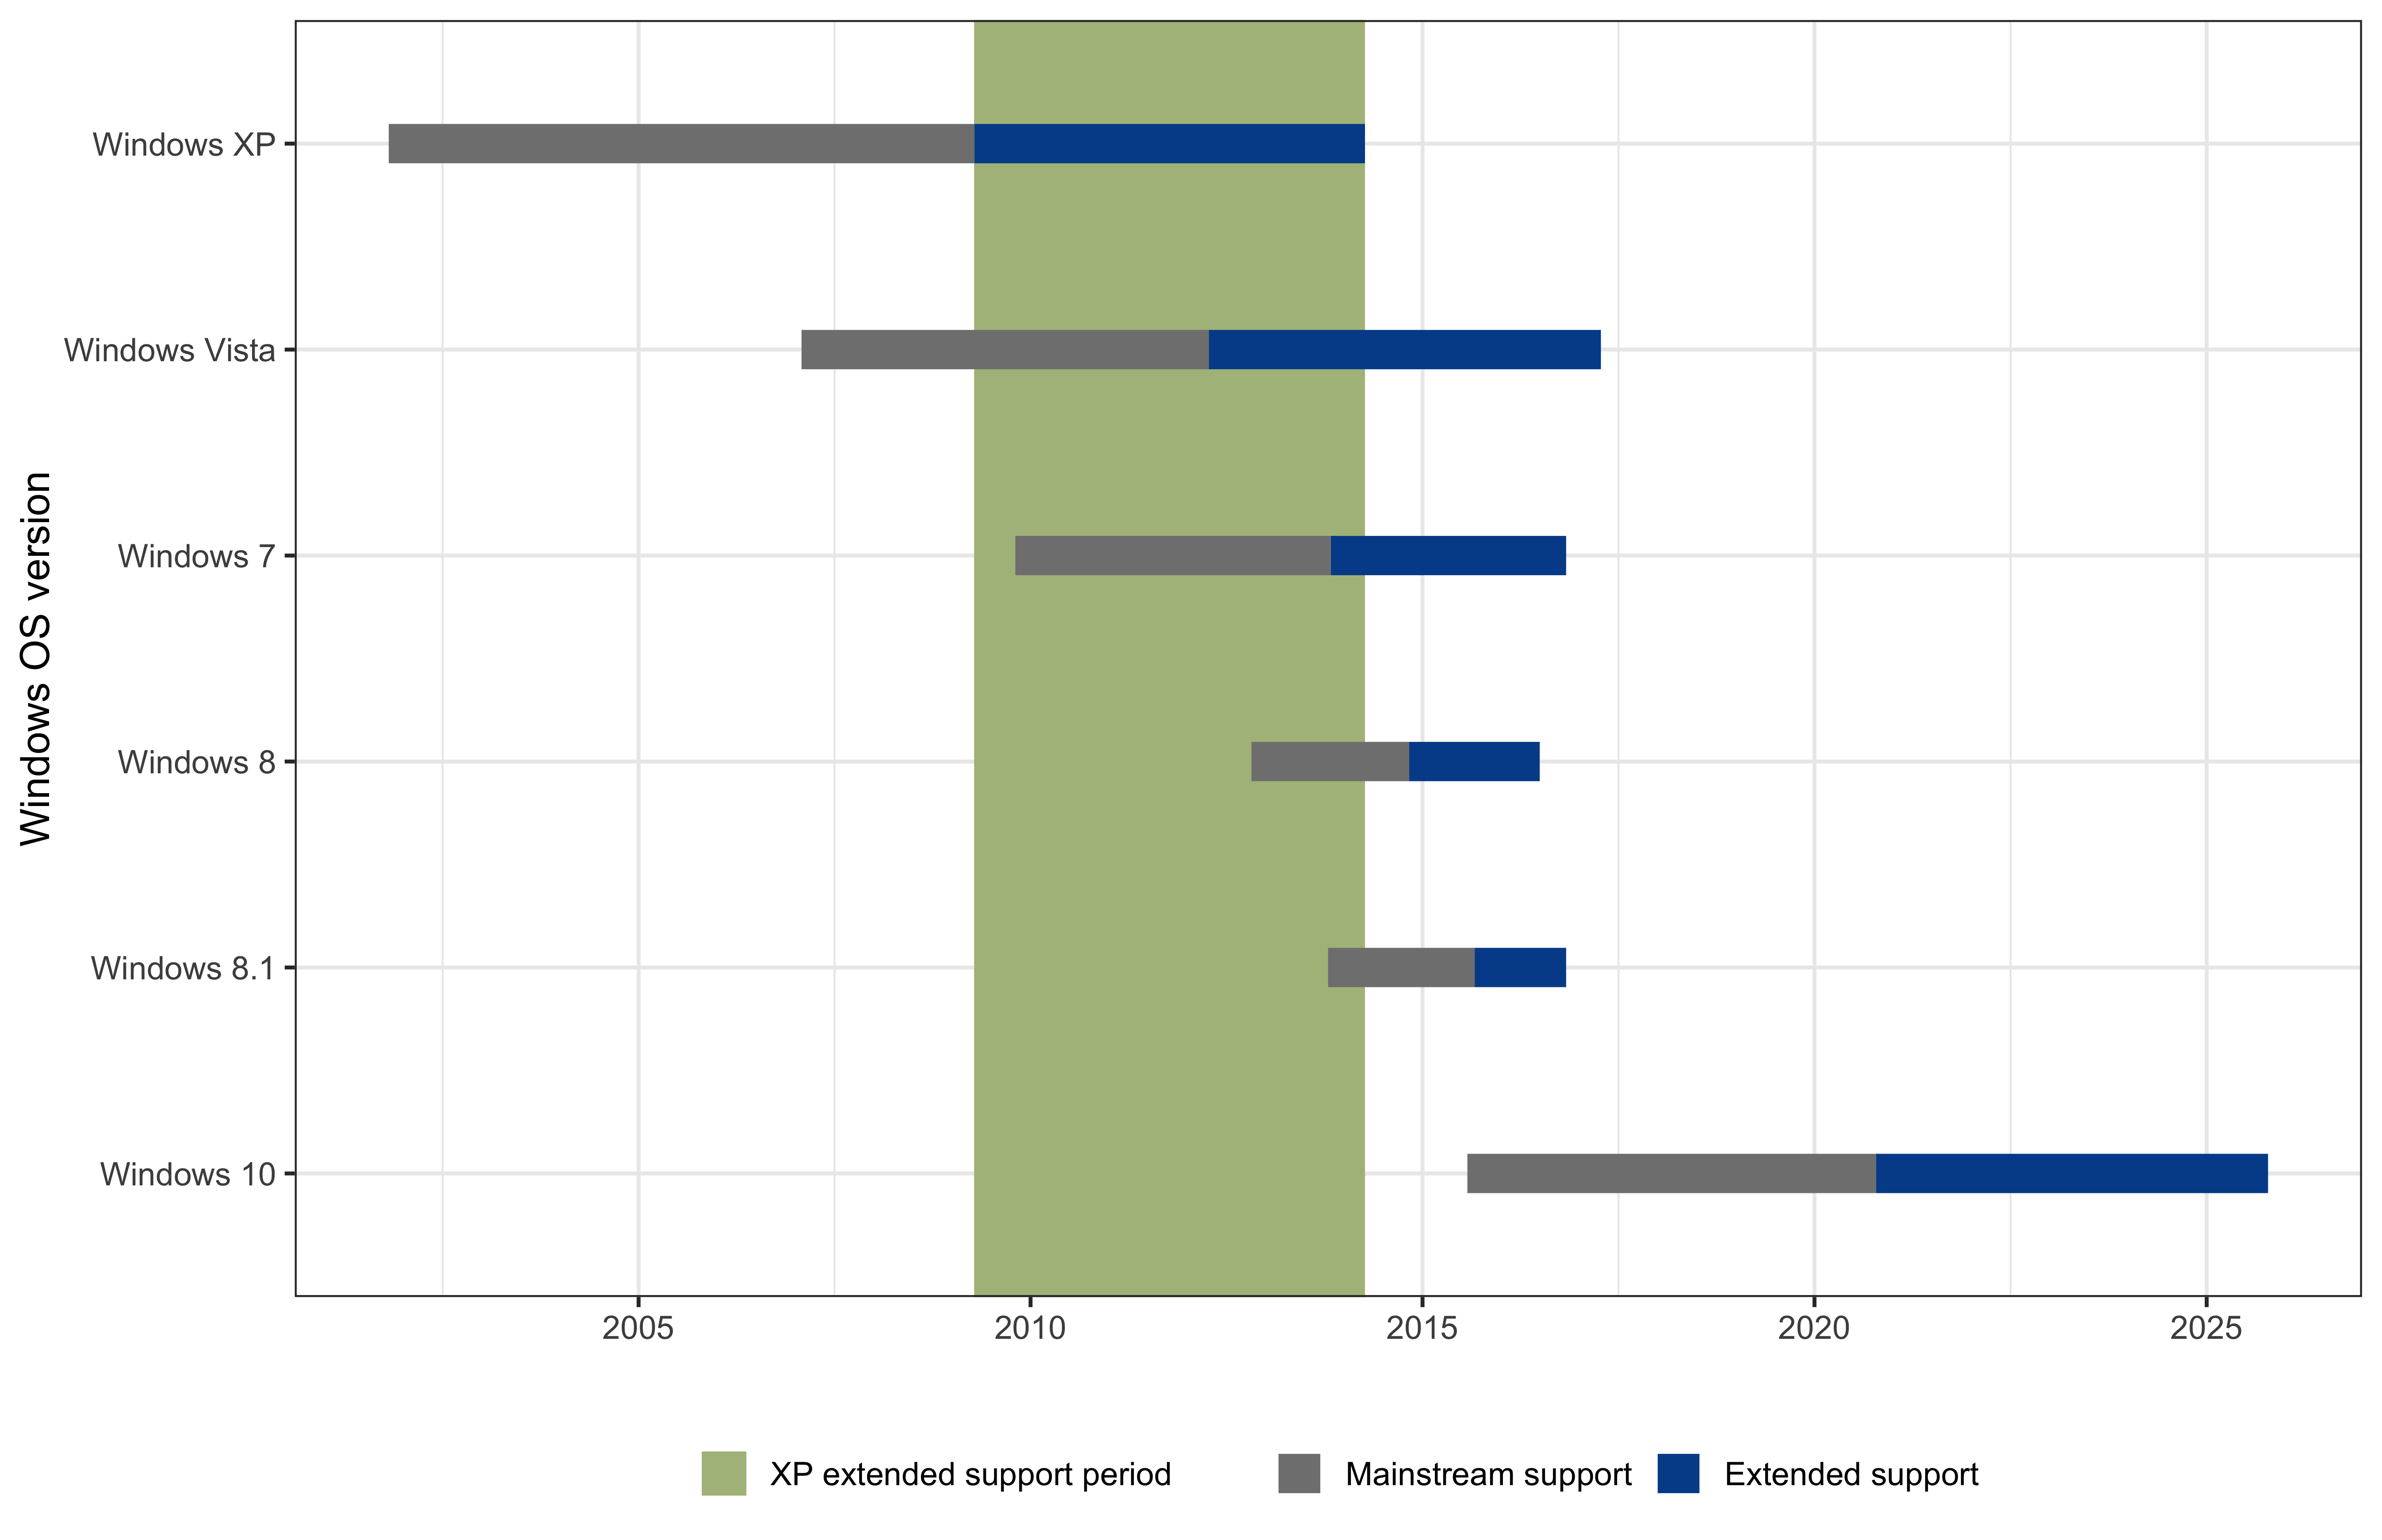 | Timeline charts are useful for visualising specific points in time and how they relate to one another.
Timelines are often require design expertise to ensure labels are not overlapping. |
|
| Time series chart | 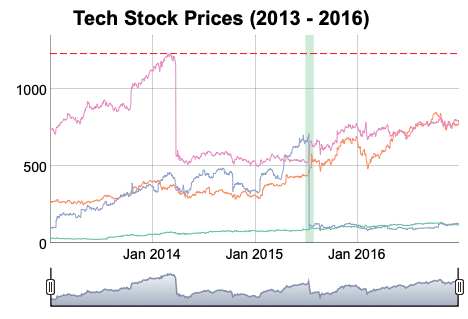 | Time series charts are useful for visualising how one or more variables vary over time.
Time series charts are extremely popular in financial and business sectors. |
|
| Specialist financial charts | 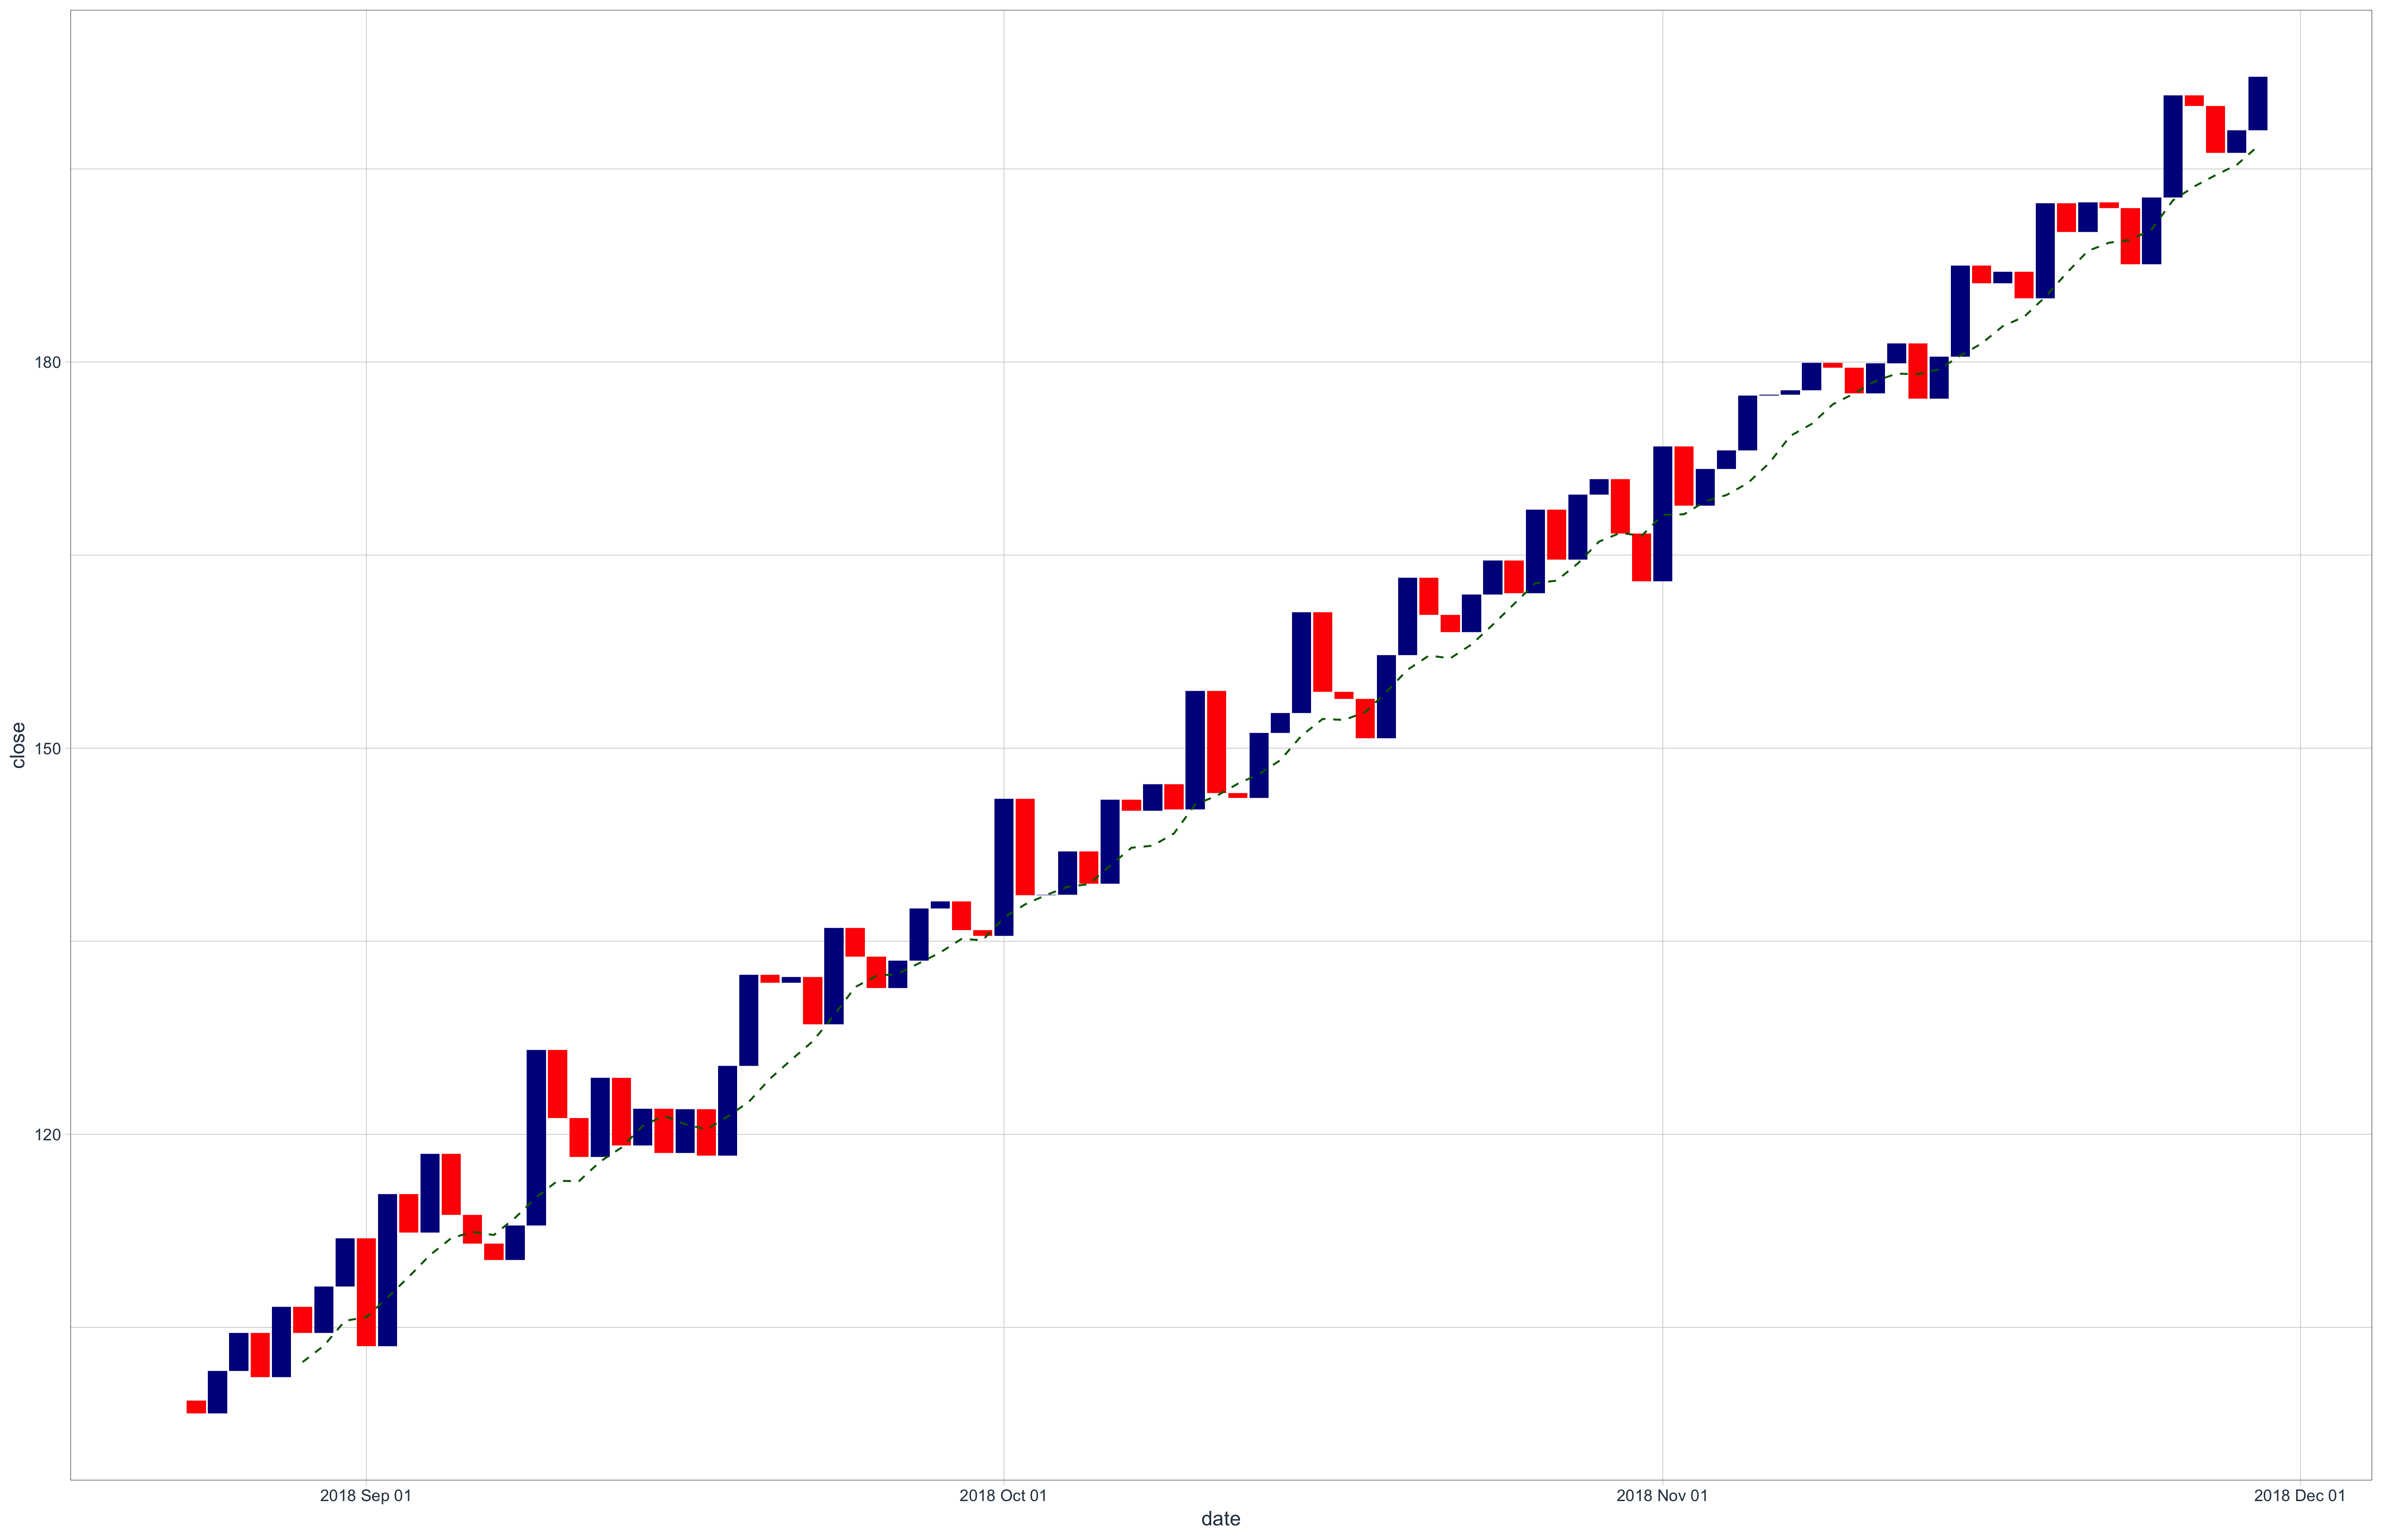 | There are a wide range of specialised time series visualisations used in the finance industry. It is usually difficult for users outside of the industry to read and easily understand the complexity of these visualisations.
It's recommended that you only use these dataviz where strictly necessary. | Strongly depends on the specifc dataviz of choice. |
You must use both consistency and sense when working with temporal data. It is highly recommended that you use the ISO 8601 format:
- Date format: yyyy-mm-dd
- Time format: hh:mm:ss
- Combined date and time (UTC time zone) format: yyyy-mm-ddThh:mm:ss+00:00
If MS Excel is included in your data processing workflow it is extremely likely that your dates will have been converted into Excel format. Excel dates are an example of a epoch dates.
Epoch dates in Excel
Epoch date systems count the number of units if time that have elapsed since an epoch (start) date/data-time. MS Excel has a particularly complicated date system. Take the Excel sheet below which contains Christine Lagarde’s (Head of the MFI) date of birth:
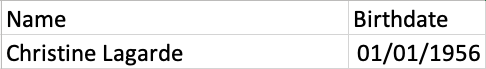
This is stored within Excel as 20455.0, i.e. 20,455 days since the epoch time of January 0, 1900. There’s a good discussion of why 0th January and not 1st January here.
There are many different tools for converting between MS Excel date formats and the ISO 8601 format, but these depend very much on what dataviz technology you are using.

