Geovisualistions (Maps)
Maps, Geoviz and GIS
Creating dataviz of geographic data (or showing data on a map) is a more involved process than creating charts, and requires specialist GIS software or packages. Typically, geographic dataviz seek to communicate one of five things:
- Points/Locations on a map: buildings, cities, and countries.
- Journeys between locations on a map: flight paths, roads, and hurricane tracks.
- Regions on a map: zipcodes, city borders, and country borders.
- Topographical properties of Earth: ocean trenches and contour maps of mountains/hills.
- Meteorological data: this data often requires extremely specialised visualisations.
If you’ve never worked with GIS data before you’re advised to consider contacting an expert as there are complex questions regarding; map projections, coordinate reference systems, base maps and more. This page is designed to provide you with enough information to decide what type of map and data preparation you’ll need to do before talking with an expert.
Country Population
in 2005
0 – 10 million10 – 20 million
20 – 30 million
30 – 40 million
40 – 50 million
50 – 60 million
60 – 70 million
70 – 80 million
100 million+
Leaflet | Tiles © Esri — Sources: GEBCO, NOAA, CHS, OSU, UNH, CSUMB, National Geographic, DeLorme, NAVTEQ, and Esri
| Name | What is this useful for? | Required GIS Data |
|---|---|---|
Scatter geo plot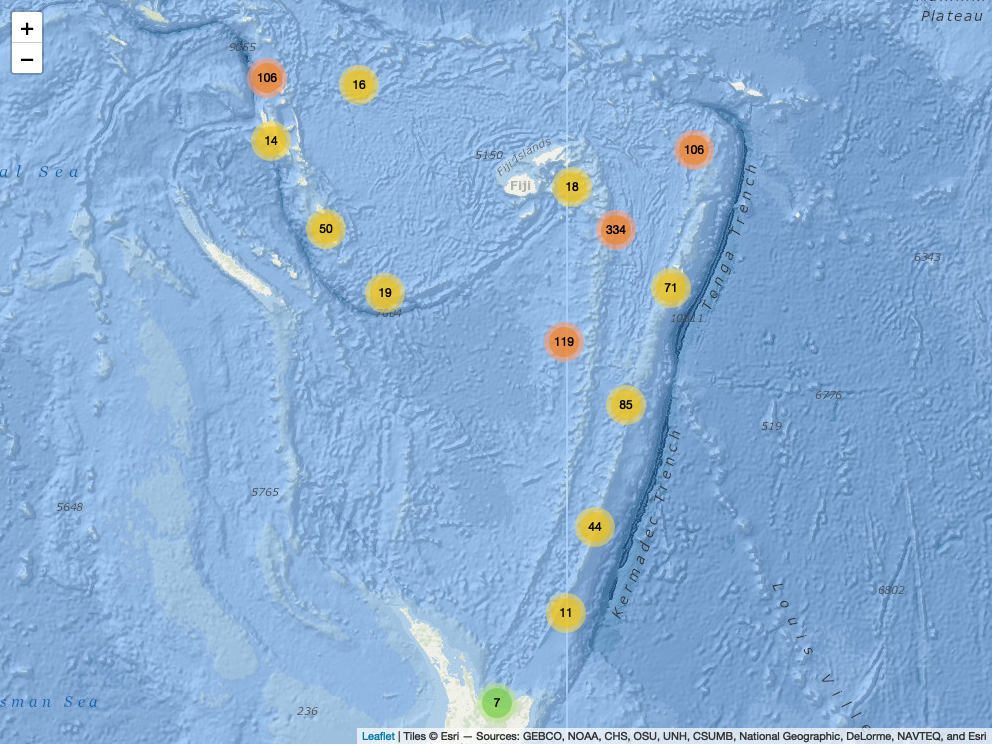 | Scatter geo plots are useful for showing specific locations, for instance; cities, wildlife filming equipment or earthquakes.
Sometimes it is useful to cluster together locations, as in the example image here. |
|
Choropleth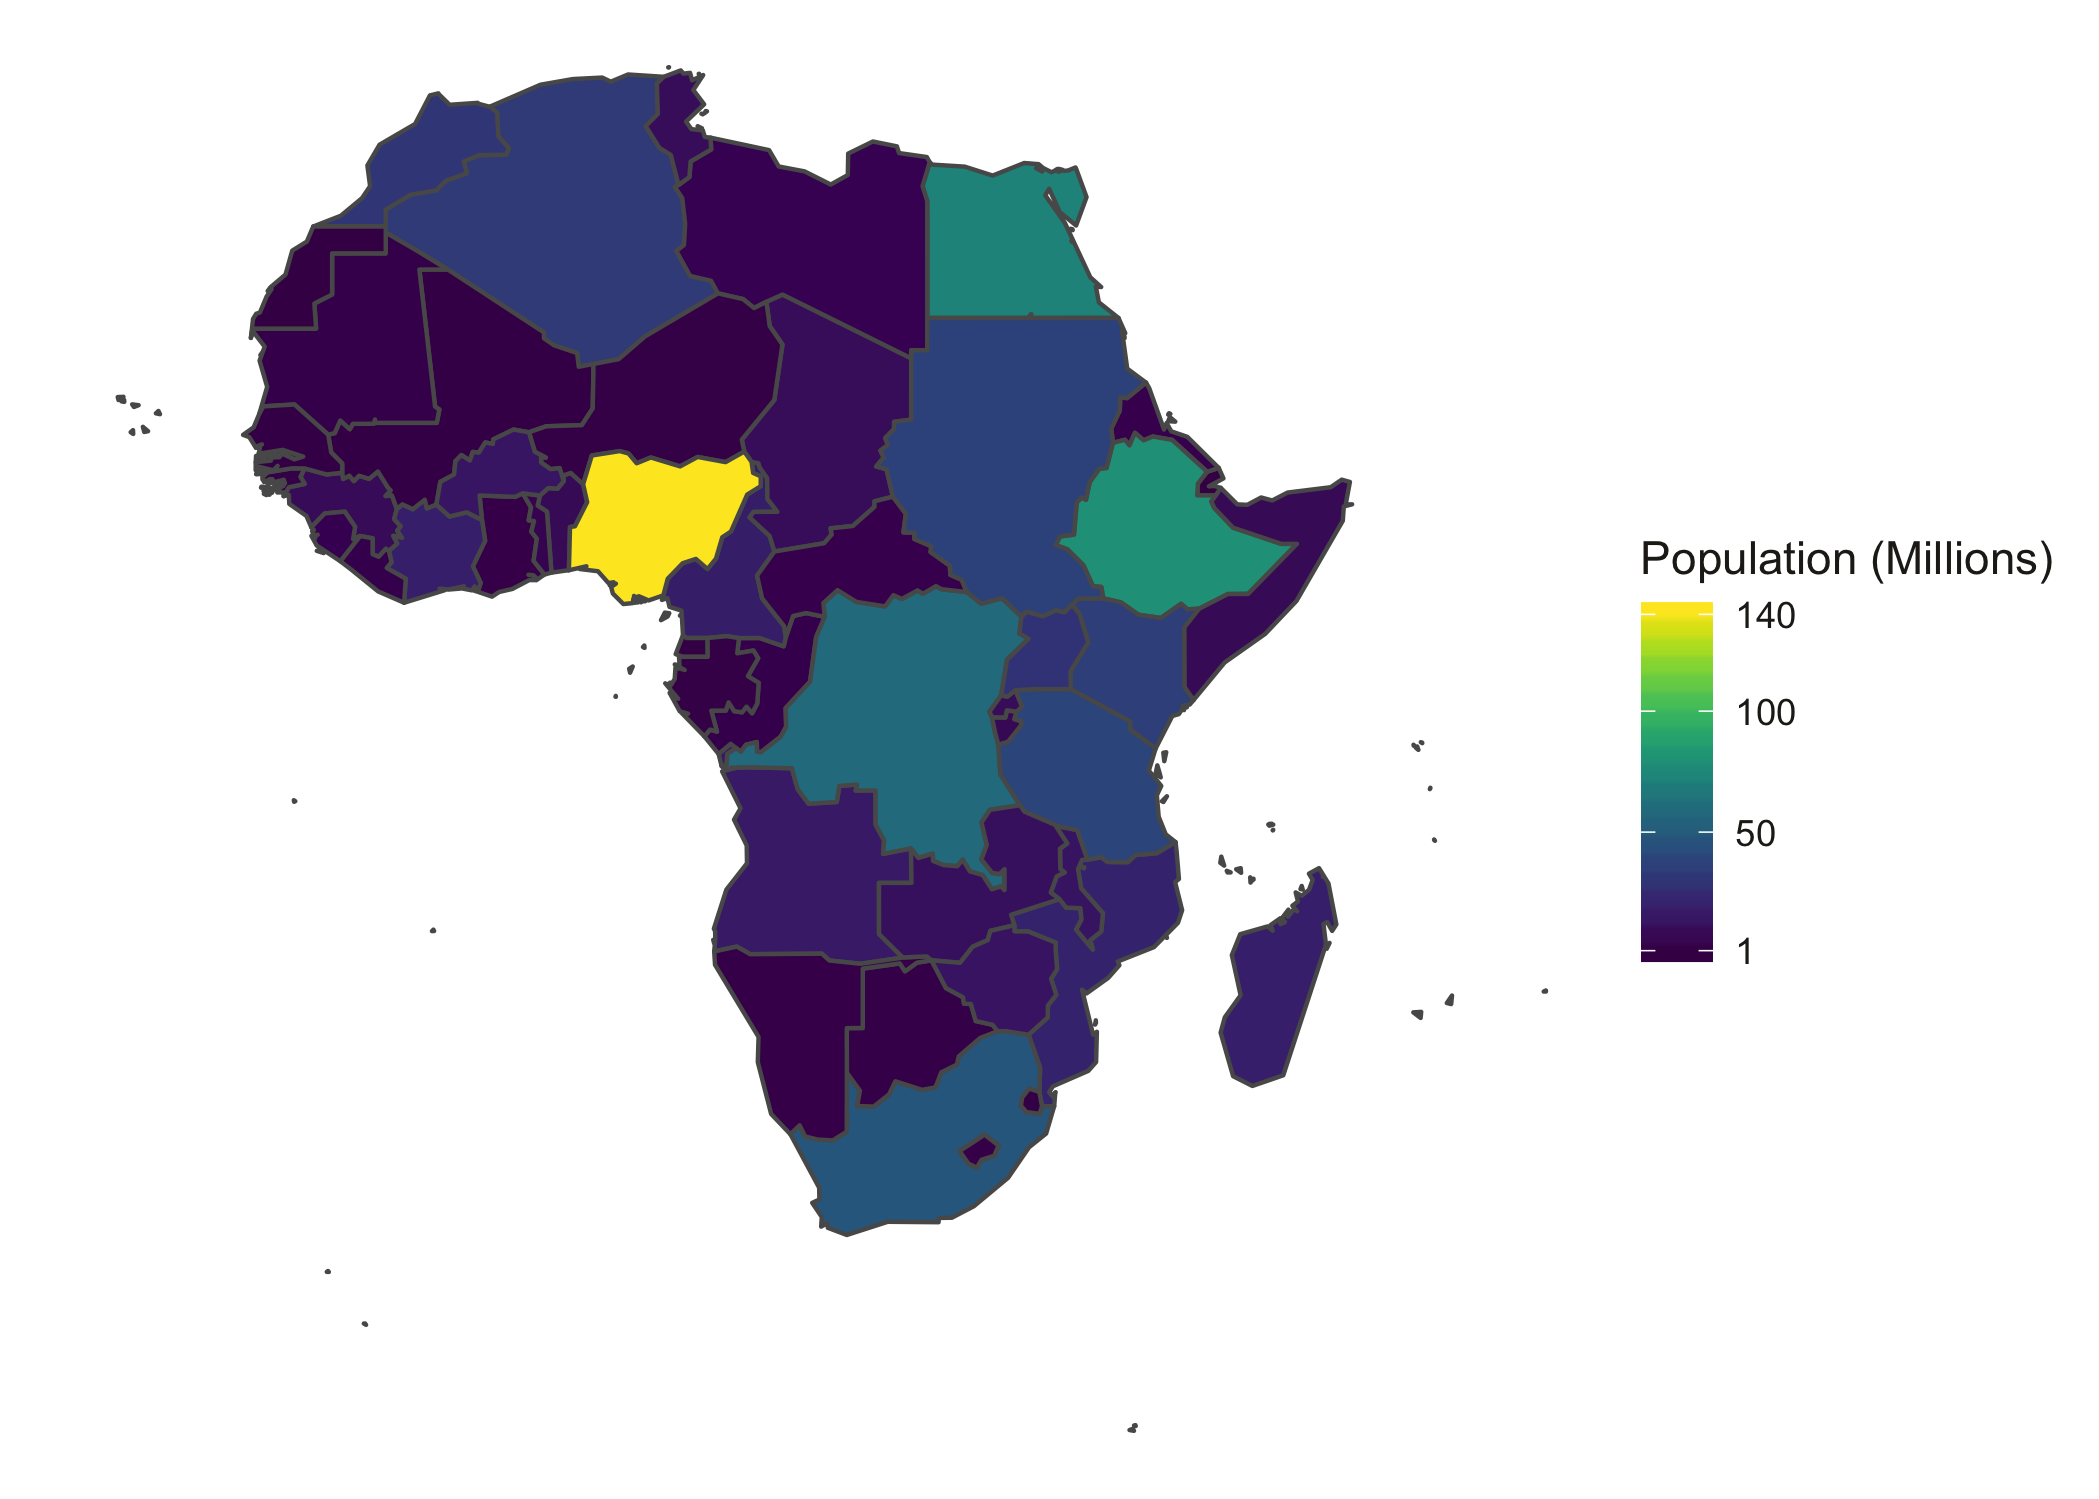 | Choropleth are useful for comparing different regions to one another, for instance visualising the individual country populations for a continent. | Technically, choropleth do not need any data other than user supplied shapefiles. However, base maps will help orientate the user. |
Cartogram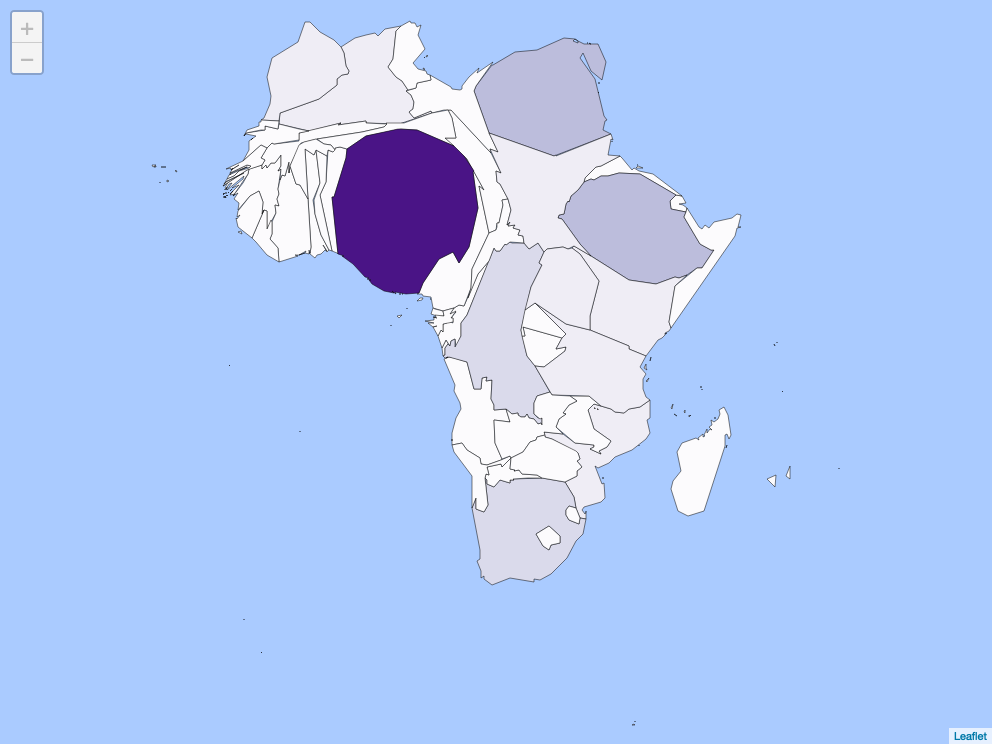 | Cartograms are useful when it's desirable to compare how a variable (i.e. population) per square unit varies between regions.
In this example the African continent has been distored by the population of each country, relative to it's physical size. | Cartograms require the exact same types of data as choropleth. However, you will need to select an appropriate shape distortion algorithm. |
&_biz_n=0&rnd=18621&cdn_o=a&_biz_z=1755390224867)
&rnd=530823&cdn_o=a&_biz_z=1755390224868)